Ubuntu Server Monitoring
I have a small Ubuntu server running at home. I use it as a NAS and to host lightweight applications like a photo gallery tool.
Since its resources are quite limited, I would like to know how the RAM and CPU are fairing over time. After a short disucssion with an LLM, it looks like netdata is a promising tool. Let’ s see how to install and use it.
The installation is actually straightforward. All I need was to follow the instructions on this page. It tooks some time, but finished without error.
A quick sudo systemctl status netdata show some red errors. However, doing sudo journalctl -u netdata -f shows that the service ultimately started properly.
Since I am on the same local network, I can leave the dashboard’s port open and access it directly via my browser: http://<server ip>:19999 .
The home page opens, inviting me to sign in. There is a link at the bottom to skip this step.
I then landed on the metrics page, which is quite dense.
For my needs, the metrics I really care about are:
- avg cpu
- avg ram used
- network outbound
- network inbound
Ideally, I would want a graph of each of those metrics overtime.
I then went to the dasboard page. Here, adding graphs is quite straightforward. Here are the metrics’ name:
- cpu:
system.cpu - ram:
system.ram - network inbound/outbound:
system.net
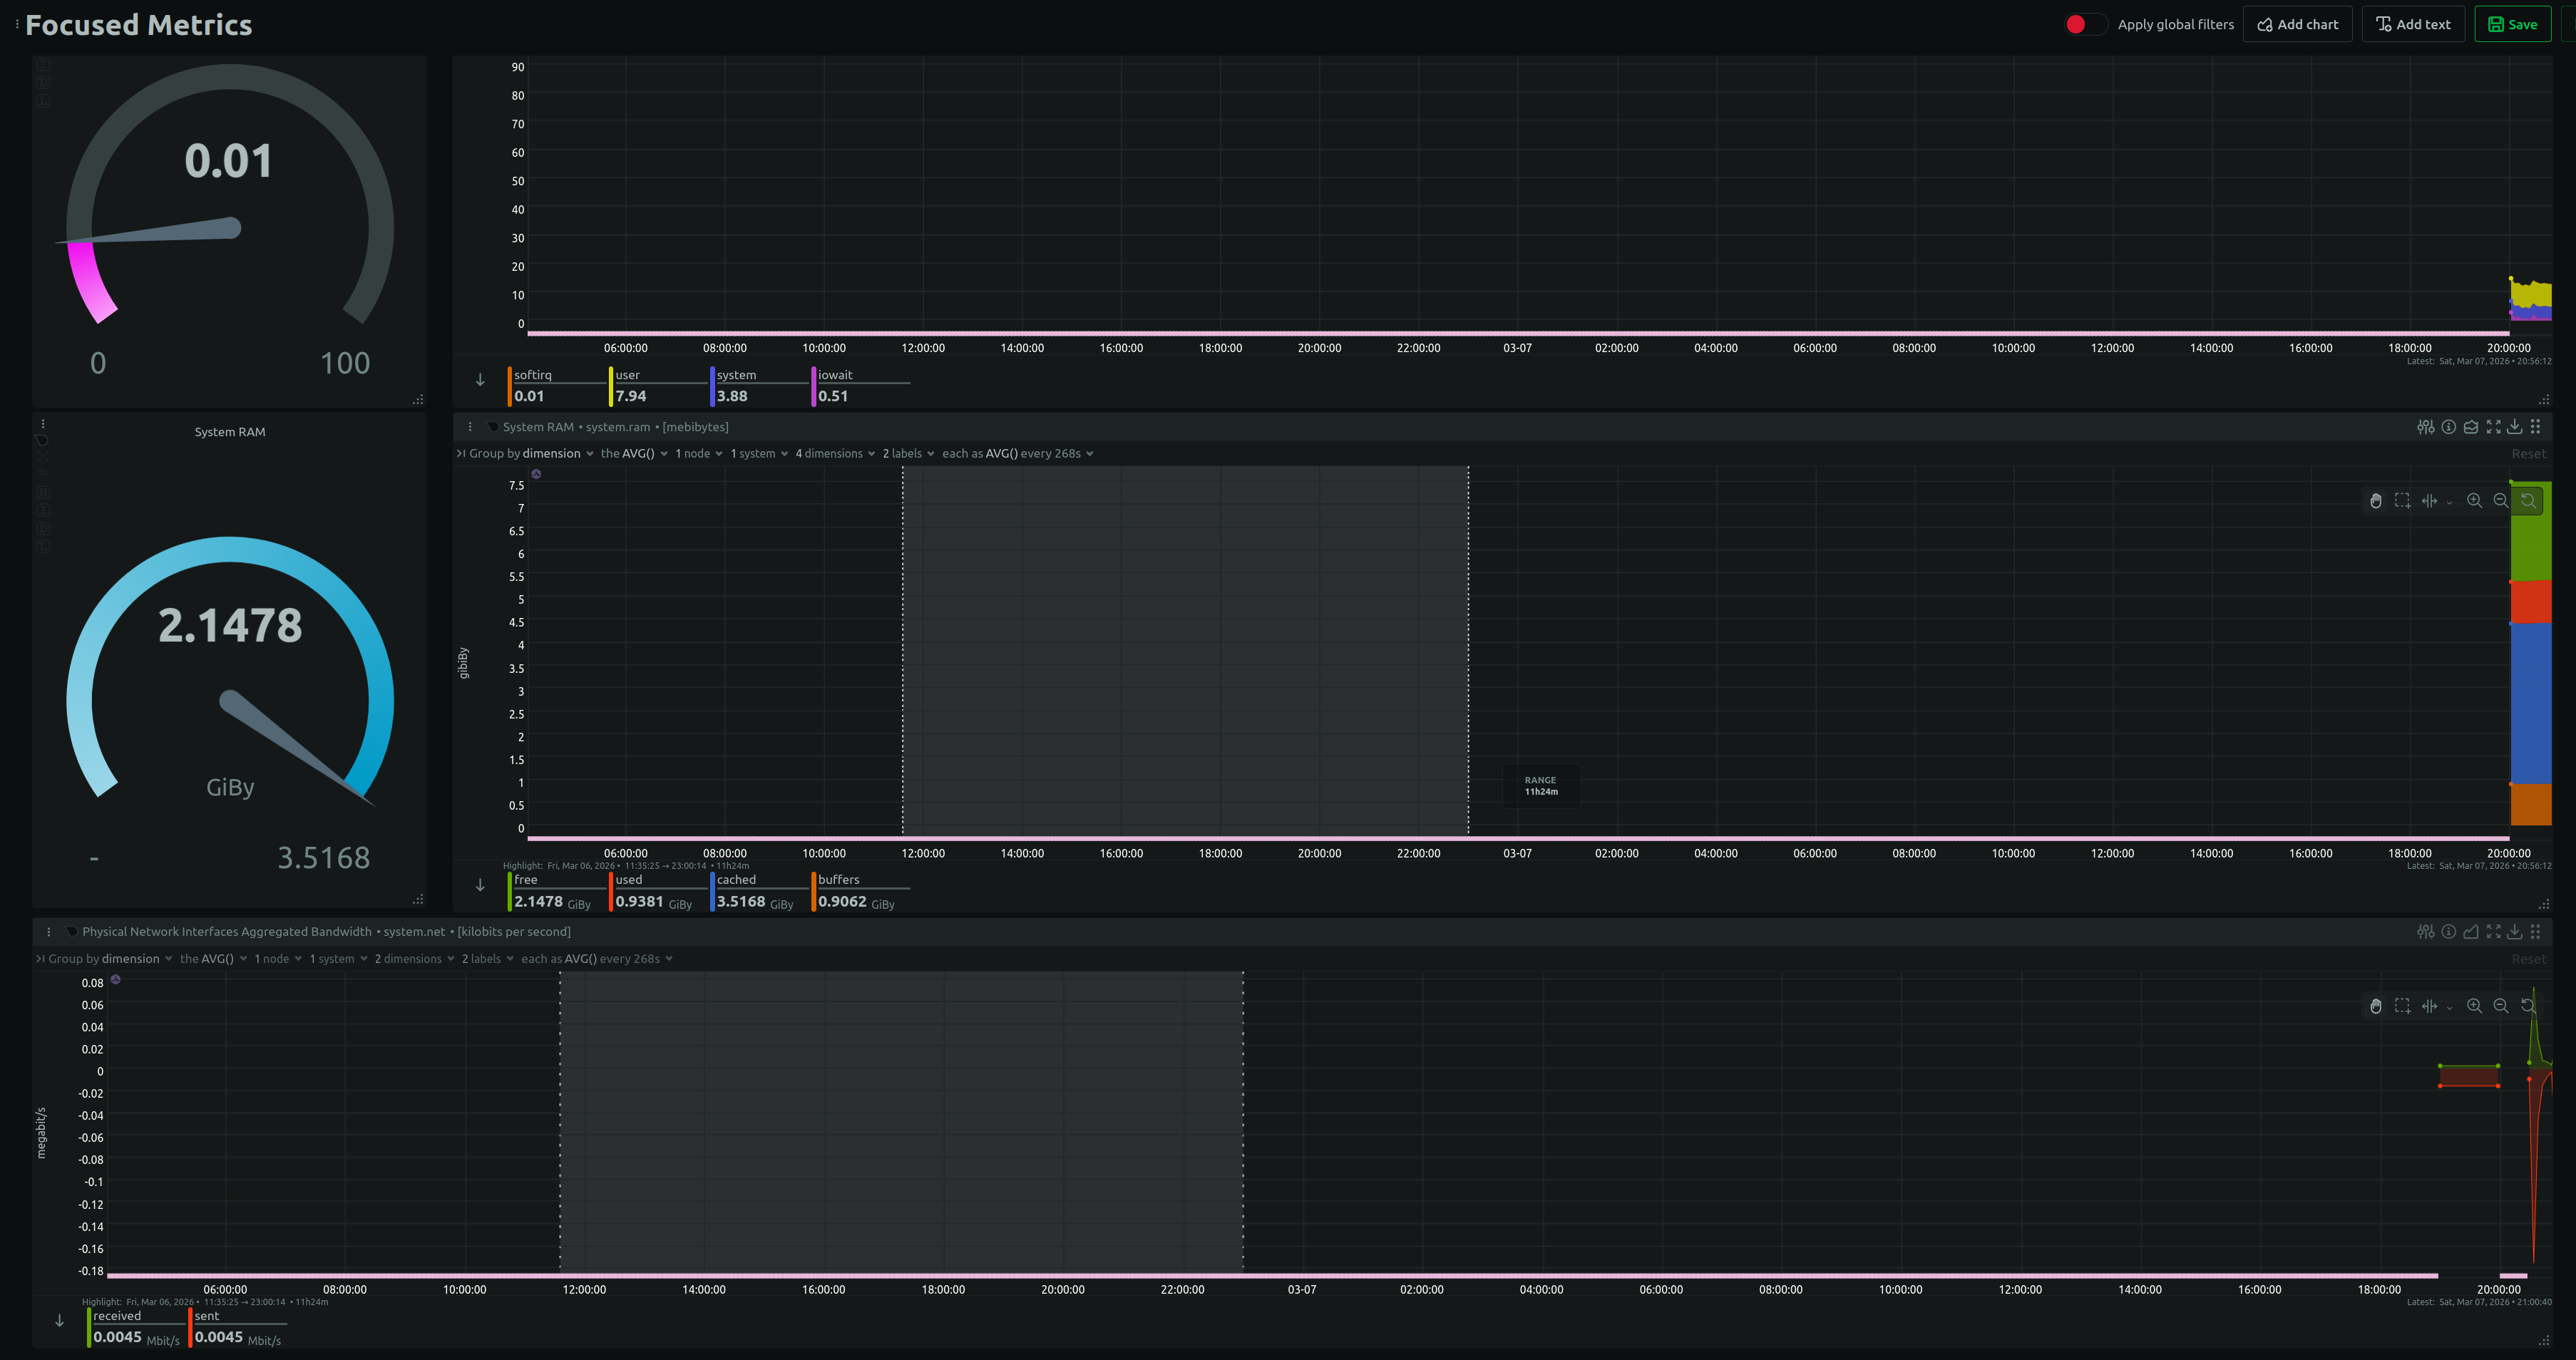
In the header of each graph, it’ s possible to change the type of graph, so I put a gauge beside the chart over time. I then added a line graph for the network load at the bottom. It looks like this:
I wanted to make sure that I would be able to see far enough in the past. THe idea is to check here and there how the server behaved and have a way t odetect anomalies at a glance. This page explains how to download and edit the configuration file.
This page talks about retention period. By default, the per hour data are kept for 2 years (or 1GB file, whichever comes first). This is enough for me, so I guess I am done!